Oil City, PA Visit on August 30, 2010
SWC member Tom Karg invited me to visit some oil fields in the Oil City, PA area. The purpose was to discuss his data collection needs from a field perspective. As you will see from the discussion, using the iPhone for data collection and display could be a great money and time saver in the oil field.
Oil City is in western Pennsylvania at the foothills of the Appalachian Mountains. The Allegheny River winds it’s way though the city. The area has a rich oil related history dating back to August 27, 1859 when Colonel Edwin L. Drake drilled the first commercially successful oil well. Through most of the 20th century Oil City was the hub of the oil industry with headquarters of Pennzoil, Quaker State and Wolf’s Head located there. Over 150 years later, oil and gas are still found and produced in the area.
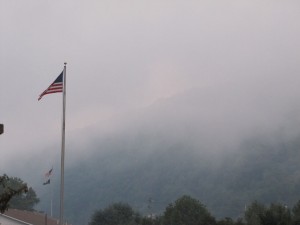
August 30 was a perfect day for going out into the field. The temperature was mild and the access roads were dry and passable. The early morning view was absolutely beautiful as the clouds covered the tops of the surrounding wooded hills as seen in the picture. If you could look through the trees, you would see oil wells dotting the landscape. That was our destination.
–
–
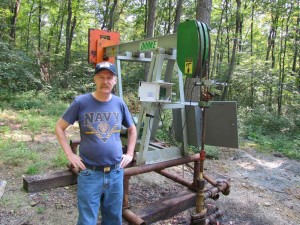
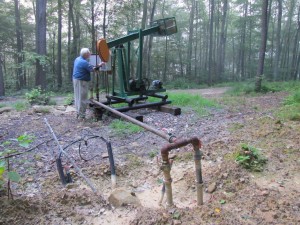 Our first stop was at a group of four wells. The picture shows a typical configuration. The wells in the region are shallow as indicated by the size of the pump jack. The average might be 1500 feet, with some less than 1000 feet deep. You can see that the electrical service is buried as well as the pipeline, which connects with the other wells in the group. Tom is adjusting his pump-off controller for the day’s production.
–
–
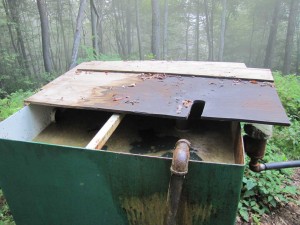 Some of the local wells have multiple producing zones. The wells we visited had about 25% oil and 75% brine. Tom said that some wells might produce up to 80% to 90% oil and very little brine. The oil separation process for these wells is extremely simple as shown in the image of the separation tank. The oil enters the tank from the four wells through the pipe in the foreground. Tom said the oil separates almost immediately and is taken off of the top. The brine is taken from the bottom of the tank. Both fluids are gravity fed to the tank battery downhill.
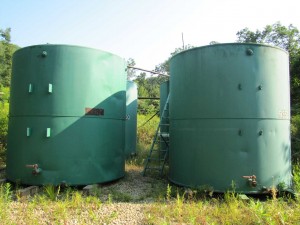 The tank battery for the wells is shown in the adjacent image, and is typical of the installations I saw elsewhere. You will notice that the equipment pictured is painted green, as if to blend with the environment. One observation I made was that each site I visited was very clean. Hardly any oil was on the ground and the environmental impact of the wells and access roads was minimal.
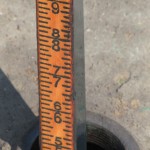
If you look at the top of the tank on the right, you can see the measuring gauge sticking out of the top of the tank.
–
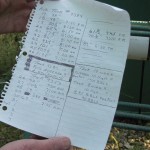
Record keeping at this tank battery is accomplished with a sheet of paper kept on-site in a weatherproof container. The record contains the tank number, depth, date and time. The depth is recorded with the measuring gauge pictured on the right.
–
–
–
Not much gas is produced by these specific wells, and what little is recovered is vented to the atmosphere. Paraffin production can be problematic in some wells requiring periodic treatment.
–
–
–
–
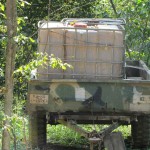 At another field we visited I noticed that supporting equipment and materials, such as the chemical containers in the picture, were stored in the field. Materials inventory and location is something that could be tracked by an iPhone application.
–
–
–
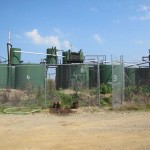 The tank battery from the largest field we visited featured a greater number of tanks. It also placed the separation tanks on the top of the larger oil tanks as can be seen in the picture. The brine tanks are downhill a short distance away.
–
–
–
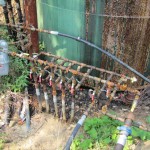 The header system for the flow lines from groups of wells is shown in this picture. The valve handles quickly show which lines are open or closed. A gas meter on the left monitors gas from the wells that is collected.
–
–
–
–
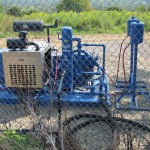 The gas compressor is shown in this picture. It receives gas from the wells and compresses it in preparation for sale.
–
–
–
–
 While we were looking at the tank battery, a load of brine had just been picked up. The driver said he visits the site at least once a day to keep up with the brine production. The brine is taken to a processing plant nearby where the recovered fresh water is discharged into the Allegheny River.
–
–
–
Data Collection in the Oil Fields of Western Pennsylvania
 Regarding the iPhone hardware, it seems well suited to use in the field. The screen is readable in field conditions and doesn’t wash out even in bright daylight conditions. Cell reception ranged from very weak to medium strength in the hills. Tom’s cell phone showed about the same reception on the Verizon network as the iPhone did on the AT&T network. Verizon might have been slightly better. Tom mentioned that pumpers in the field used text messaging rather than voice communication because even in weak reception areas, the text messaging works sufficiently well. General iPhone application usage in the field was not a problem, and the battery was easily recharged when needed with a 12V adapter in the truck. The iPhone camera proved to be easy to use and could be potentially useful in the field for documenting various conditions. (Note: The images above were taken with a Canon camera.) The iPhone GPS was tested and could also prove useful for determining locations in the field. A separate report was written on the use of the GPS.
From discussions with Tom, it’s not clear that pumpers in the area keep daily records on a specific well. Their job is to successively turn on the pumps and check for any obvious problems. After letting them run for a few hours, they are turned off. The focus of the effort seems to be at the tank battery where the oil is gauged on a daily basis.
Tom Karg’s interest in more efficiently using each pump led to the development of his pump-off controller (see web site at: http://oilwellsentry.com/default.aspx). The device is attached to the pump and is turned on each day by the pumper. It pumps the well until there are no more fluids left to pump, and then shuts off the pump automatically. The pump-off controller records the amount of time it ran and an LED displays the result. The pumper can record the time and track the results over the days of operation. Monitoring the pump-off times can indicate a number of things to the operator such as paraffin build-up, casing leaks or the impact of other wells.
In order for Tom to determine the production efficiency of a particular field, he would like to have daily pump-off times of each well along with the amount of oil produced, as measured by the tank gauge. Having easy access to the data as charts or plots on a handheld iPhone would be a great advantage. While collecting the information for these few readings would be would be straightforward, we realized that the same person might not be collecting all the data for the field. A pumper might collect the pump data, while an owner might gauge the tanks. Thus, the data would be spread across two different devices, yet both parties would need to see all the data together on their individual iPhone. This requires that the iPhones for a particular field would need to be networked together in such a way that their data could be shared.
Stripper Well Instrumentation
As an engineer, I noticed a number of things at the wellsite that would be interesting to monitor and could provide useful information. Unfortunately, the cost, and more complex installation would be prohibitive, not to mention the additional data that would be presented to the operator for analysis. I’ll go ahead and list a few things for future thought.
1. Motor amperage would indicate the power required for both the upstroke and downstroke. Excessive current would indicate motor problems.
2. Acceleration of the horse head can be used to monitor the strokes per minute.
3. The temperature of the fluid pipe can be used to determine if fluid is being pumped from the well. If the pipe remains at ambient temperature while the pump is running, oil is not flowing through the pipe and could be leaking back into the casing, or could indicate a downhole pump failure.
4. Vibration of the electric motor can be monitored. If vibration is excessive, there could be bearing problems, or the belt could be loose.
5. Gas pressure can be monitored. Excessive gas pressure can indicate several things that would need attention.
6. Liquid level measurements can be automated. There are a number of devices on the market for this task.

1 ping
Western Pennsylvania Trip Report » SWC Project Blog
September 9, 2010 at 1:28 pm (UTC -4) Link to this comment
[…] Oil City, PA Trip […]